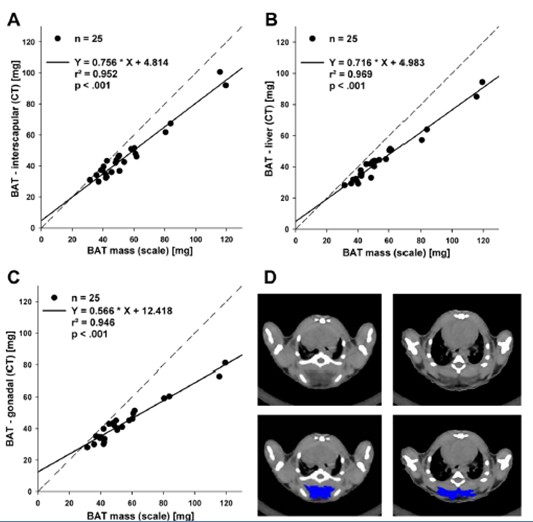
(selected from PLoS ONE, May 2012) The LCT200 has a built-in standard protocol for brown fat measurement to detect the distribution and volume of brown fat in the body. This technology has been patented in Europe and the United States and is safer than using isotope. Background: Modern lifestyles lead to high levels of obesity. Obesity caused by imbalances in energy intake and consumption is often accompanied by symptoms such as high blood pressure, dyslipidemia, and coronary heart disease, which ultimately leads to abnormal metabolism. The distribution of fat, not the total amount of fat, determines the state of metabolism. Subcutaneous fat is beneficial to the human body, and increased visceral fat and abnormal fat mass in the liver, skeletal muscle and pancreas increase the risk of type 2 diabetes. Another closely related to metabolic diseases is the widespread non-alcoholic fatty liver disease. Recently, brown fat (BAT) has gradually attracted widespread attention. The study of brown fat is mainly concentrated in small animals. However, new data indicate that BAT also plays a role in adults. The amount of BAT is negatively correlated with BMI, indicating the role of brown fat in energy metabolism in humans. Brown fat is responsible for breaking down white fat body tissue that causes obesity, converting it into carbon dioxide, water and heat. It can speed up the body's metabolism and promote white fat consumption. In view of the unique performance of brown fat in metabolism, it has become a research hotspot in recent years. In the specific experimental operation, it also faces the problem of how to measure brown fat. Latheta LCT200's unique European and US patents give it the ability to measure brown fat, the world's only micro-CT that measures brown fat. The LCT-200 has a built-in standard protocol for brown fat measurement to detect the distribution and volume of brown fat in the body. This technology has been patented in Europe and the United States and is safer than using isotopes. METHODS: We used different models of lean and obese mice (C57BL/6, B6.V-Lepob, NZO) to determine the optimal scanning parameters for scanning fat at different sites. The data is compared to the actual weighing after scanning. The amount of liver fat is determined by biochemical analysis. Figure 2. Brown adipose tissue. Correlation between resected brown adipose tissue (BAT) weighted on scale and estimations of fat depotweights by CT. (A) BAT depot in situ (interscapular), (B) resected BAT depot inserted under the liver, ( C) resected BAT depot inserted in gonadal fatdepot; dashed line – identity line, r2 - coefficient of determination. (D) Analysis examples of two different slices of interscapular brown adipose tissuedepot by ImageJ (NIH) program. Upper panel: raw gray scale scan Slices, lower panel: manually outlined and selected BAT in ImageJ (NIH). Animal fat analyzer Echo MRI  : http://?equipid=3273016&division=1908 The world's only small animal that can measure brown fat CT: http://?equipid=3088364&division=1908
Medical Cold Patch
Patch For Diarrhea,Medicated Patches For Arthiritis,Plaster For Diarrhea,Pad For Diarrhea Shandong XiJieYiTong International Trade Co.,Ltd. , https://www.xjpatches.com
The current gold standard for detecting abdominal fat and liver fat content is MRI and CT. The body fat of mice is usually measured by quantitative magnetic resonance (QMR), which is accurate in measurement, does not require anesthesia of animals and is fast, but does not distinguish between subcutaneous fat and visceral fat, so in this experiment We used LaTheta LCT-200 to distinguish between abdominal fat and subcutaneous fat and to quantify the two parts of fat. We also used the instrument to measure liver fat content and brown fat.
RESULTS: The correlation between the weight of the adipose tissue and the CT measurements was: subcutaneous fat (r2 = 0.995), visceral fat (r2 = 0.990), total white fat (r2 = 0.992). In addition, the use of the abdomen Scanning of the area (between lumbar vertebrae L4 and L5) and body fat can reduce scan time and reduce radiation and anesthesia to experimental animals.
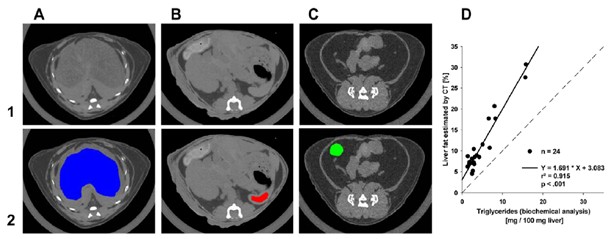
The amount of liver fat obtained by CT scan was linearly correlated with the results of biochemical analysis (r2 = 0.915). In addition, CT measurements of brown fat were highly correlated with the results of the balance measurements (r2 = 0.952). Short-term freezing (4 ° C, 4 hours) resulted in a change in brown fat content, which caused less triglyceride, which was reflected by an increase in CT values ​​during CT imaging.
Conclusion: LCT200 is reliable and accurate for 3D imaging and quantitative analysis of total fat, subcutaneous fat, visceral fat, brown fat and liver fat in mice. This non-invasive method allows us to conduct long-term scanning studies on obesity in mice. 

Patch for diarrhea
[Name] Medical Cold Patch
[Package Dimension] 5cm 4pieces/box
The pain relief patch is composed of three layers, namely, backing lining, middle gel and protective film. It is free from pharmacological, immunological or metabolic ingredients.
[Scope of Application] For cold physiotherapy, closed soft tissue only.
[Indications]
The patches give a fast relief for diarrhea.
[How To Use a Patch]
Please follow the Schematic Diagram. One piece, one time.
The curing effect of each piece can last for 6-8 hours.
[Attention]
Do not apply the patch on the problematic skin, such as wounds, eczema, dermatitis,or in the eyes. People allergic to herbs and the pregnant are advised not to use the medication. If swelling or irritation occurs, please stop using and if any of these effects persist or worsen.notify your doctor or pharmacist promptly. Children using the patch must be supervised by adults.
[Storage Conditions]
Store below 30c in a dry place away from heat and direct sunlight.
Quantitative measurement of brown fat and white fat
Figure 1. Quantification of hepatic fat by CT. Selected areas of liver (A; blue), spleen (B; red) and WAT (C; green) for determination of mean HU values. upper panel (1): raw gray scale scan slices (D) Relationship between amounts of intrahepatic fat isolated and quantified with biochemical analysis and estimations by computed tomography. Dashed line – identity line,r2 - coefficient of determination.